The mechanism
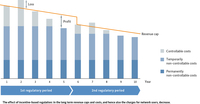
The figure illustrates the basic mechanism described.
The regulatory period in this example is five years. The revenue cap for an individual network operator in the first year of a regulatory period is based on this specific network operator's actual costs. The revenue cap is illustrated by the yellow line. In each year of the regulatory period a network operator's actual costs may be higher or lower than the revenue cap. If costs are higher, this results in a loss, as in the second year of the first regulatory period in this example. If costs are lower than the cap set, this results in a profit, as in the fifth year of the first regulatory period in this example. This incentive triggers a process similar to descending steps: the costs reduced by the network operator in one year provide the basis for the next revenue cap, which in turn provides an incentive to increase efficiency further – just as with companies in a competitive market.
The overall result in such an ideal case is that the revenue caps are lowered over time. As soon as existing inefficiencies resulting for instance from oversized administration have been eliminated, further increases in efficiency can be achieved e.g. by using innovative solutions.
The ideal pattern will, however, apply only to those network operators whose supply obligations are not subject to any significant changes. Where an operator's supply obligations are extended, requiring the operator to invest in additional installations, for example, the regulatory regime would also allow for the revenue cap to rise over time.
